Displaying Matplotlib Graphs Inline in Jupyter Notebook


- Updated to include how to modify the config file so this is the default behavior.
Recently I have begun to try, at least at a cursory level, to begin to understand some of the world of machine learning. Since I already know Python, doing this in Python seemed a good place to start. My starting point is the O'Reily book Data Science from Scratch. One of the really interesting techniques demonstrated in the book is the use of matplotlib graphs to visualize and understand the data better.
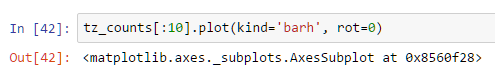
Initially though, all that happened when I tried to follow the examples was hugely disappointing.
Thankfully, the solution is on StackOverflow describes two options to get matplotlib working in Jupyter Notebook, using an import in each notebook, and how to modify the config file.
Import in Each Notebook
If you only need to get this working in one workbook you are currently using, you can just use a shortcut to change the matplotlib backend from the QT default to notebook. Use these two lines when importing matplotlib.
%matplotlib notebook
import matplotlib
The solution I am using is actually not the first listed in the above referenced solution on StackOverflow. However, this provides the most functionality. The only limitation is it requires Python 3.x. If you are like me, using Python installed with ArcGIS Pro 1.3, this is not a concern.
This solution though, must be executed every time you want to use matplotlib in Jupyter Notebook - slightly less than an optimal solution. Fortunately, you can set this up in a config file, so it works every time.
Modify the Config File
In this case we are interested in the config file for Jupyter Notebook located at ~/.ipython/profile_default/ipython_config.py. The tilde(~) simply means your profile folder. On Windows 7 this is located in the C:/Users/<profile_name>. When I looked initially, there was not even one there, so I had to create it.
You can edit this file with any text editor, so it really does not matter. In my case, I just created this file, and added the one critical line to it.
c.InteractiveShellApp.matplotlib = 'notebook'
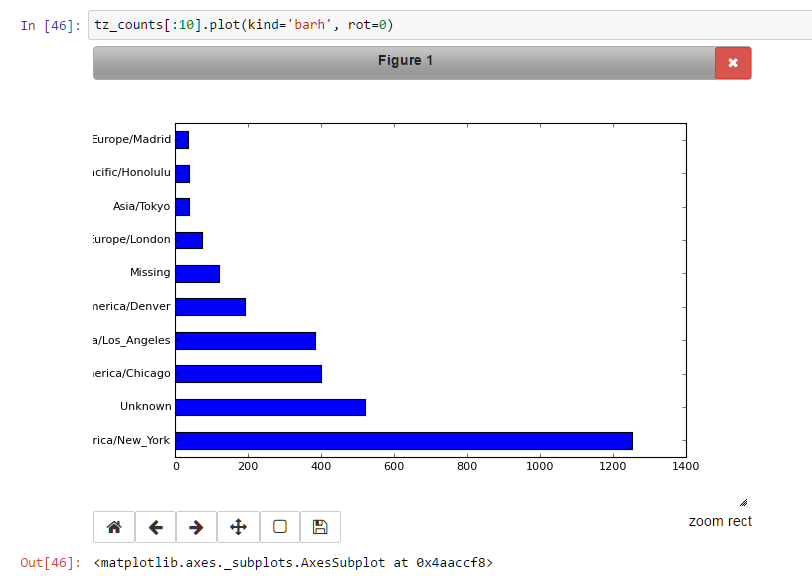
After saving this file, every time you now import and use matplotlib in Jupyter Notebook, instead of seeing the incredibly disappointing text shown in the first graphic above. Rather, it will look a lot more like this.
Hopefully this makes your life a little easier if you find yourself in the same situation I am in, trying to figure out this crazy world of machine learning...at least enough to be able to follow a conversation with people who really know what they are talking about!