Esri Vector Tile Basemaps...The Why

Vector tile support along with base maps are part of a recent ArcGIS Online update. So then, why do you care? Vector tiles offer potentially smaller data downloads, crisper resolution and symbology control. Are you still thinking...say what? Let me expound a bit.
First, vector tiled base maps get from the server to the client faster. The data is chunked up in a very similar way to cached base map tiles, except not pre-rendered. The server is still sending the actual vertices describing the points, lines, and polygons to the client, not just a picture taken of the line. There are a few steps taken to ensure the data is much smaller than the normal method of delivering vector data, though.
Second, since the actual shapes are being delivered to the client, the display is much sharper. Typically cached base maps are pre-rendered at what is assumed to be a normal screen resolution, around 150 dots per inch (dpi). If you are looking at this on an iThing (iPhone, iPad or Retina Mac) with a screen resolution of over 300 dpi, the base maps appear to not be as sharp as everything else on the screen. Vector tiles overcome this limitation. Since the vector data, the actual shapes, are being delivered to the client device, the shapes appear as clear as the screen resolution.
Finally, there is much more control with the client over the appearance of vector tile base maps. The appearance of the features in the base map is controlled with a small JSON file of display properties. If you do not like the way data is being displayed, simply change the JSON file and the display will be updated.
The steps required to control Esri's vector tile base maps are well documented in a well written recent Esri Blog posting by Deane Kensok, How to Customize Esri Vector Basemaps. Reading this, I got very excited. Now you can create your own custom symbology for a base map with everything staying on ArcGIS Online. This is a really big deal.
Why does this little detail matter? If you follow Deane's instructions, and create your own custom styled base map, you now have the ability to create your own look and feel for your maps without having to worry about data updates. The custom look and feel is little more than a JSON file. Whenever Esri updates the basemap with updated, more accurate and more current data, your custom base map will reflect these updates while maintaining your look and feel based on the styling in your JSON file.
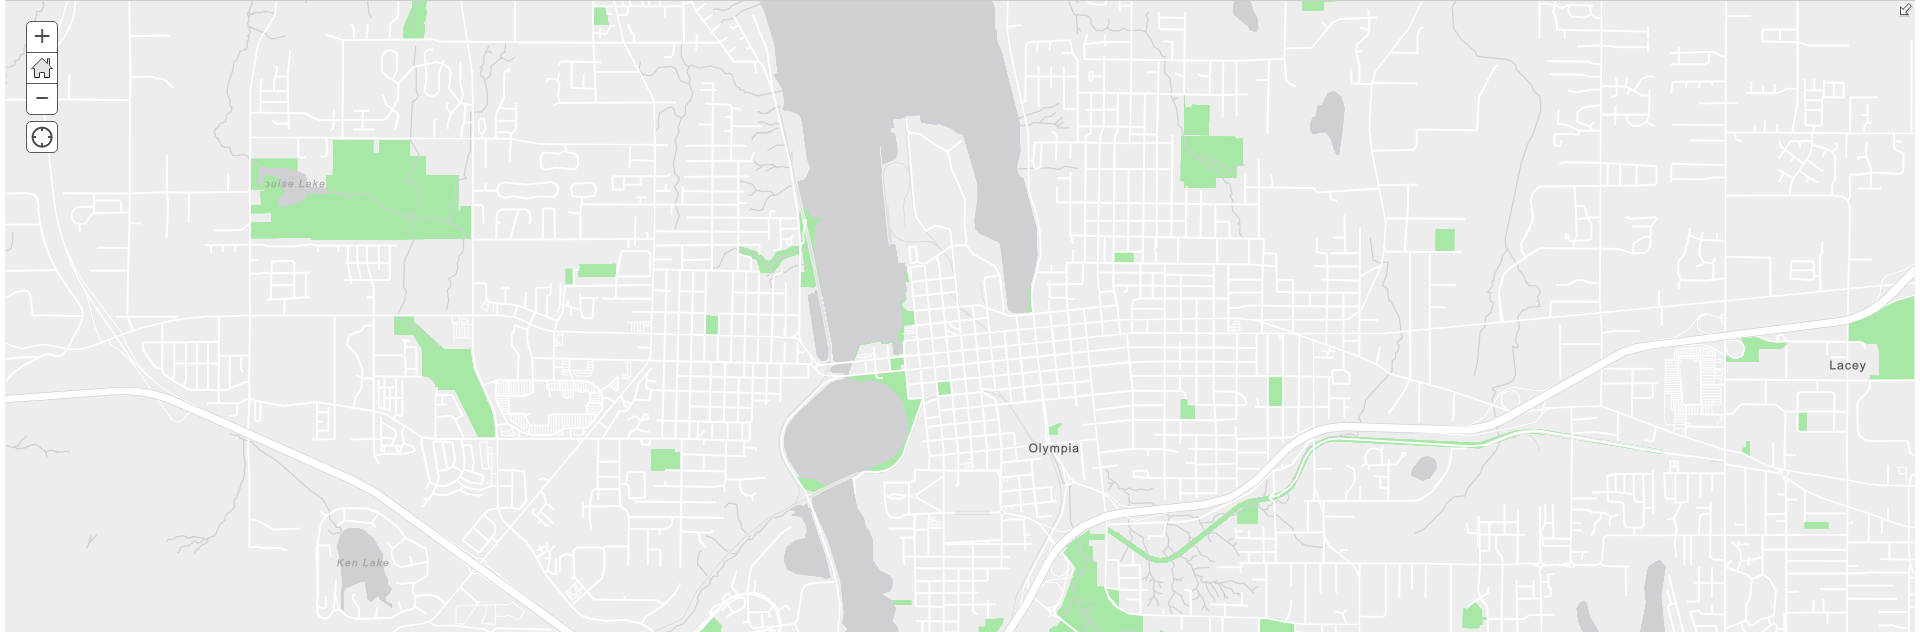
I tried this. As an example, if you were interested in highlighting the recreation resources to put a few more operational layers on top of, you can simply change the color of all the public park lands, just like in the map below.
This required little more than following Deane's instructions, finding all references to parks in the JSON and changing the color codes using an online color picker. As I continue to experiment with and learn more about vector tiles, I definitely will share my experiences here.